
The True ROI of Hospital Telepharmacy: A Director's Framework Beyond Cost-Per-Verification
A pharmacy director's framework for measuring real telepharmacy ROI: the 7 variables that matter beyond cost-per-verification.
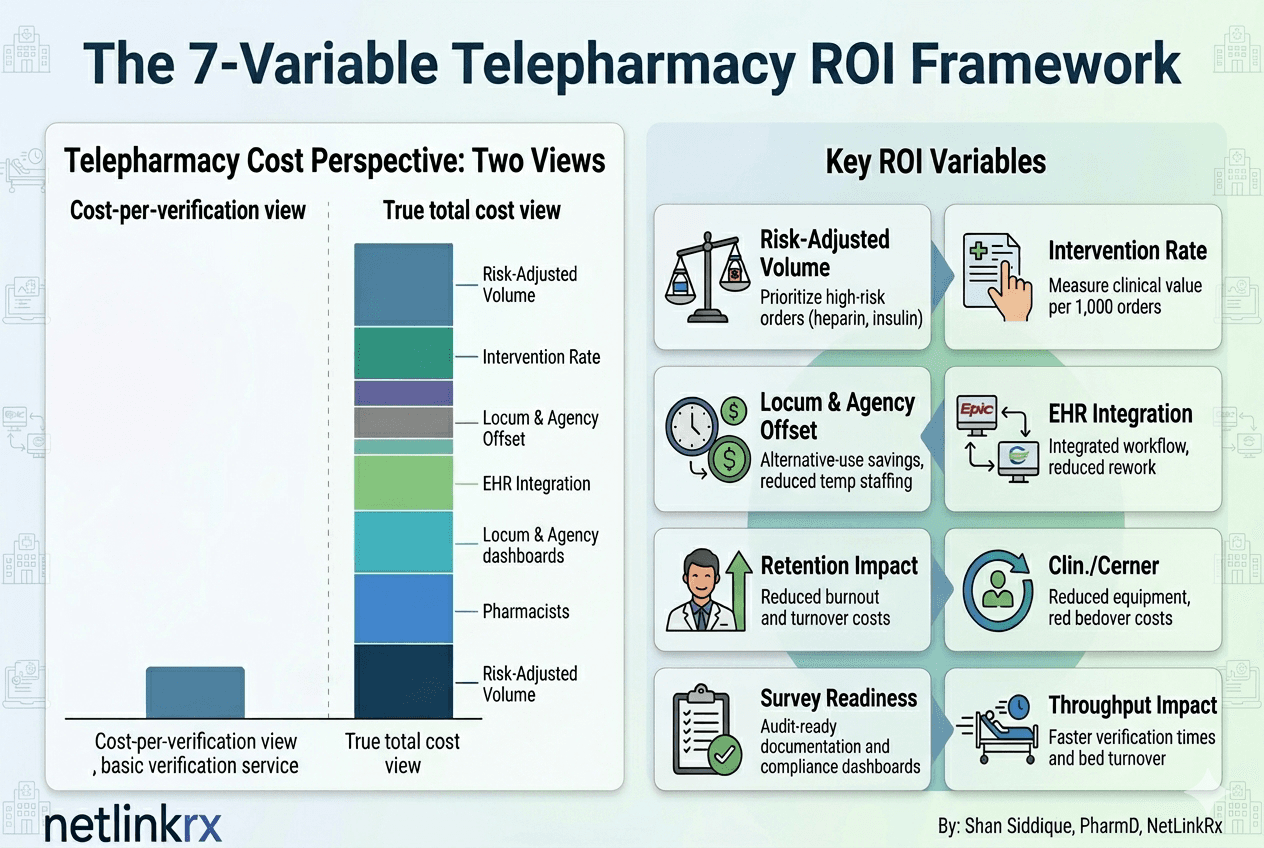
If a CFO asks you whether telepharmacy is worth it, and you answer with cost-per-verification, you have already lost the argument. Cost-per-verification is the easiest metric to compare and the worst metric for deciding. It captures roughly a third of the real economics of remote pharmacist coverage and ignores the variables that actually move risk, quality, and retention. Pharmacy directors who present a single-line bid comparison to finance will lose the conversation, and worse, lose the right partner.
This is a framework for the other two thirds.
Why cost-per-verification fails as a decision tool
Cost-per-verification is appealing because it is concrete. A vendor quotes a number, you multiply by your volume, you have a budget line. The problem is that telepharmacy is not a transactional service. It is a clinical operating model that touches staffing, safety, accreditation, and physician satisfaction. When you reduce it to a unit cost, three things happen.
First, you select for the lowest-cost provider, which usually means the highest-volume operating model. High volume per pharmacist correlates inversely with intervention rate, time spent on each order, and willingness to flag ambiguous prescribing. The savings on the spreadsheet show up as quality erosion in the survey window.
Second, you ignore the cost of doing nothing. After-hours pharmacy gaps generate downstream costs: nursing workarounds, delayed first-dose antibiotics, unverified high-risk medication orders, and length-of-stay impact. None of these appear on a vendor invoice. All of them appear on the health system's P&L.
Third, you understate the regulatory exposure. The Joint Commission, CMS, and state Boards of Pharmacy increasingly expect documented pharmacist review on every order, including overnight. A telepharmacy partner is not a labor substitute. It is a compliance posture.
The 7 variables that belong in the model
Every director should be able to defend a telepharmacy decision against a finance committee using these seven inputs.
1. After-hours risk-adjusted volume. Not raw orders per hour. Risk-adjusted orders. Heparin, insulin drips, opioids, antimicrobials, pediatric weight-based dosing, chemotherapy, and parenteral nutrition each carry different harm probabilities if verified incorrectly or skipped. Build a tiered model. The volume of high-risk orders during your unstaffed window is the variable that justifies coverage, not total volume.
2. Intervention rate per 1,000 orders. This is the closest proxy for clinical value created. Published telepharmacy data and ASHP guidance both treat intervention rate as a primary quality metric. A vendor running at 5 to 8 interventions per 1,000 orders is doing meaningful clinical work. A vendor running at 1 to 2 is processing keystrokes. The delta between those two vendors, multiplied by your annual order volume, is the avoided harm cost.
3. Locum and agency offset. What you pay per shift to fill overnight pharmacist coverage with locum or agency labor is the alternative-use cost. Many hospitals quietly underestimate this because the spend is buried across temp staffing budgets. Pull 12 months of locum pharmacist invoices before you compare any telepharmacy bid.
4. EHR integration and workflow overhead. Some telepharmacy vendors operate inside your Epic, Cerner, or Meditech build. Others operate outside it and require dual documentation. The integrated model usually costs more per verification and saves dramatically on nursing rework, duplicate documentation, and reconciliation effort. Account for the integration tier in the cost stack.
5. Pharmacy department recruitment and retention. A reliable overnight telepharmacy partner makes your in-house overnight role easier to recruit and easier to retain. The math here is simple. The fully loaded cost of a pharmacist turnover is between 0.75x and 1.5x annual salary depending on the source. If telepharmacy reduces overnight burnout enough to retain one mid-career pharmacist per year, that is six figures of avoided cost that never appears on the vendor invoice.
6. Quality and survey readiness. TJC and CMS expect documented pharmacist review and intervention activity. A telepharmacy partner that produces real-time intervention dashboards, exception logs, and audit-ready documentation reduces survey preparation time and survey risk. Ask vendors to show you the artifact a surveyor would receive, not the marketing summary.
7. Throughput impact on bed turnover. Slow first-dose verification delays admission orders, transfer orders, and discharge medications. Telepharmacy speed against your in-house benchmark is a length-of-stay variable. If a vendor can show median verification time inside 10 minutes during peak hours, that is a throughput asset. If they cannot, ask why.
How to model it
The cleanest way to present this to finance is a two-column comparison. Column one: status quo, including locum spend, estimated harm cost from gaps, retention impact, and compliance risk reserve. Column two: telepharmacy model, with the same line items, plus vendor cost, minus avoided locum, minus avoided turnover, minus avoided harm. The bottom line is rarely the unit price. It is the delta in total cost of pharmacy coverage with risk priced in.
Most directors find that when they include even three of the seven variables, the cheapest vendor on cost-per-verification is no longer the cheapest vendor on total cost. The math typically inverts somewhere between variable two and variable five.
Common modeling mistakes
Three errors show up in nearly every telepharmacy business case when the procurement framework defaults to cost-per-verification.
The first is treating the after-hours window as homogeneous. A 2 AM order on a med-surg floor and a 2 AM order in a 24-bed ICU are not the same risk. Build your volume model with shift-by-shift unit context, not a single overnight aggregate. The model gets sharper and the value case gets clearer.
The second is using vendor-quoted intervention rates without an external benchmark. Vendors define interventions differently. Some count clarification calls. Some count clinical recommendations only. Some count any change to an order. Demand a definition before you compare numbers, and ask each vendor for a sample audit log of 50 consecutive interventions so you can see what actually counts.
The third is forgetting the in-house team in the comparison. The wrong telepharmacy partner makes your day-shift pharmacists more frustrated, not less, because they spend the morning cleaning up overnight queue confusion. The right partner makes day-shift pharmacists faster, because the overnight workflow is documented, integrated, and clinically aligned with day-shift practice. That delta is real and it is rarely modeled.
The quality-versus-volume distinction
Here is the deeper point. Telepharmacy operating models split into two camps. One camp scales by volume. The pharmacist count grows linearly with client count, ratios are high, intervention rates are moderate, and the unit cost is low. The second camp scales by quality. The pharmacist count grows ahead of client count, ratios are deliberately constrained, intervention rates are higher, and the unit cost is higher.
The first model wins the spreadsheet comparison. The second model wins the survey, the medication safety committee, and the retention conversation. Most hospital pharmacy departments need the second model and accidentally select the first because the procurement framework rewards the first.
If you walk into your CFO meeting with a 7-variable model, you make the second model defensible.
NetlinkRx point of view
NetlinkRx was built to be the second camp. We are quality-driven, not volume-driven. Our pharmacist-to-client ratios are deliberately lower than the industry norm. Every NetlinkRx engagement is designed to be built into the partner hospital's EHR, with full intervention documentation, real-time dashboards visible to the hospital's pharmacy and finance leadership, and outcomes that are built to be measured and shared. We believe pharmacy directors should be able to defend their telepharmacy decision in front of any committee, with data, on any day. That is what we build for.
Request the worksheet
If you are building or refreshing your telepharmacy business case, NetlinkRx will share our 7-variable ROI worksheet with any hospital pharmacy leader who asks. No pitch, no demo gate. Reach out through netlinkrx.com.
References
- The Joint Commission. Medication Management standard MM.05.01.01: a pharmacist reviews the appropriateness of all medication orders before dispensing, with limited exceptions for urgent clinical situations. Link
- American Society of Health-System Pharmacists. ASHP Statement on Telehealth Pharmacy Practice. American Journal of Health-System Pharmacy. 2022;79(19):1728. Link
- Scott DM, Friesner DL, Rathke AM, Doherty-Johnsen S. Medication error reporting in rural critical access hospitals in the North Dakota Telepharmacy Project. American Journal of Health-System Pharmacy. 2014;71(1):58-67. Link
Want hospital telepharmacy insights every Tuesday?
The NetlinkRx Brief publishes weekly for pharmacy leaders on operational ROI, clinical quality, regulatory shifts, and the future of the department. Direct, cited, no fluff.